Author name: kamrul

Nothing to say ... just enjoying and sharing my posts... with friends.. :D

How to Create a Heat Map in Excel: Visualize Data like a Pro with Step-by-Step Instructions

In today’s data-driven world, visualizing information is crucial for effective analysis and decision-making. Heat maps have emerged as a powerful tool that allows us to understand data patterns and relationships at a glance. Whether you’re a business analyst, a marketer, or a researcher, learning how to create a heat map in Excel can greatly enhance

How to Create a Heat Map in Excel: Visualize Data like a Pro with Step-by-Step Instructions Read More »

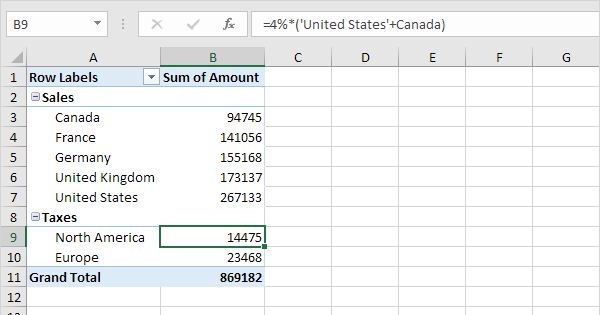
How to Create a Calculated Field and Calculated Item in a Pivot Table in Excel (Step-by-Step Guide)

Title: How to Create a Calculated Field and Calculated Item in a Pivot Table in Excel (Step-by-Step Guide) Calculated Field/Item in a Pivot Table Step 1: Create a Pivot Table Step 2: Access the PivotTable Fields Pane Step 3: Create a Calculated Field Step 4: Create a Calculated Item Step 5: Enter the Formula for

How to Create a Calculated Field and Calculated Item in a Pivot Table in Excel (Step-by-Step Guide) Read More »

Excel’s Calculated Fields/Items: Easy Data Analysis

Excel’s Calculated Fields and Calculated Items are powerful features that enable easy data analysis by performing calculations on existing data within PivotTables. These calculations can help you gain insights, perform aggregations, and create custom calculations based on the data available in your PivotTable. Calculated Fields: A Calculated Field is a new field that you can

Excel’s Calculated Fields/Items: Easy Data Analysis Read More »

How To Perform Descriptive Statistics In Excel (Very Easy!)

Performing descriptive statistics in Excel is straightforward and can provide valuable insights into your data. Here’s a step-by-step guide on how to do it using Excel’s built-in functions: Step 1: Prepare your Data Step 2: Calculate Mean (Average) Step 3: Calculate Median Step 4: Calculate Mode (if applicable) Step 5: Calculate Minimum and Maximum Step

How To Perform Descriptive Statistics In Excel (Very Easy!) Read More »

How to Analyze Data in Excel: Simple Tips & Techniques

Analyzing data in Excel involves using various features and techniques to gain insights, identify patterns, and make informed decisions based on the information presented. Here are some simple tips and techniques to help you analyze data effectively in Excel: Sort Data: Filter Data: PivotTables: PivotCharts: Conditional Formatting: Charts and Graphs: Data Validation: Formulas and Functions:

How to Analyze Data in Excel: Simple Tips & Techniques Read More »